How to Analyze Customer Churn Before Achieving Product-Market Fit
Pre-PMF churn analysis focuses on qualitative insights over vanity metrics. Learn the framework that Y Combinator startups use to validate product-market fit through retention curves, exit interviews, and leading indicators.
How to Analyze Customer Churn Before Achieving Product-Market Fit
If you're a founder staring at your churn dashboard wondering whether a 60% monthly churn rate means you should pivot or persevere, you're asking the wrong question. Before achieving product-market fit, traditional churn metrics can be dangerously misleading—and optimizing for the wrong numbers can actually delay your path to PMF.
I've worked with dozens of Y Combinator startups in their earliest stages, and the ones that successfully navigated to product-market fit shared a common trait: they treated churn as a qualitative research opportunity, not a quantitative benchmark to hit. Here's the customer churn analysis framework for pre-product-market-fit startups that actually works.
Why Traditional Churn Metrics Fail Pre-PMF Startups
When you're pre-PMF, you're not running a business—you're running an experiment. The rules that govern growth-stage companies simply don't apply yet. A SaaS company with product-market fit might panic at 5% monthly churn, but for a pre-PMF startup, that same number could be excellent or terrible depending on context.
The fundamental difference is this: growth-stage churn is about execution (onboarding, customer success, feature gaps), while pre-PMF churn is about validation (are you solving a real problem for the right people?). Benchmarking your 3-month-old product against industry averages is like comparing a prototype to a production vehicle—the comparison itself is flawed.
The danger of focusing on absolute churn numbers pre-PMF is that it encourages you to optimize for retention before you've validated problem-solution fit. You might reduce churn by adding features, improving UX, or offering discounts—but if you're solving the wrong problem, you're just building a better version of something nobody wants.
The Pre-PMF Churn Analysis Framework
What Are the Leading Indicators of Churn in Early-Stage Products?
Most founders track lagging indicators—metrics that tell you churn already happened. But pre-PMF, you need leading indicators that predict churn before it occurs, giving you time to intervene or learn.
| Leading Indicators (Predictive) | Lagging Indicators (Reactive) |
|---|---|
| Time to first value (activation) | Monthly churn rate |
| Feature adoption depth (using core features) | Customer lifetime value |
| Engagement frequency (daily/weekly active usage) | Cancellation rate |
| User onboarding completion rate | Revenue churn |
| Support ticket volume per user | Net retention rate |
The most critical leading indicator is time-to-value—how quickly a new user experiences the core benefit of your product. In my experience advising early-stage startups, products that deliver value within the first session have 3-4x better retention than those requiring multiple sessions to "get it."
Track how deeply users engage with your core features. Are they using the one feature that delivers your unique value proposition, or are they bouncing around surface-level functionality? Shallow engagement is a leading indicator that users don't understand your value or don't find it compelling.
How Do You Measure Churn Before Achieving Product-Market Fit?
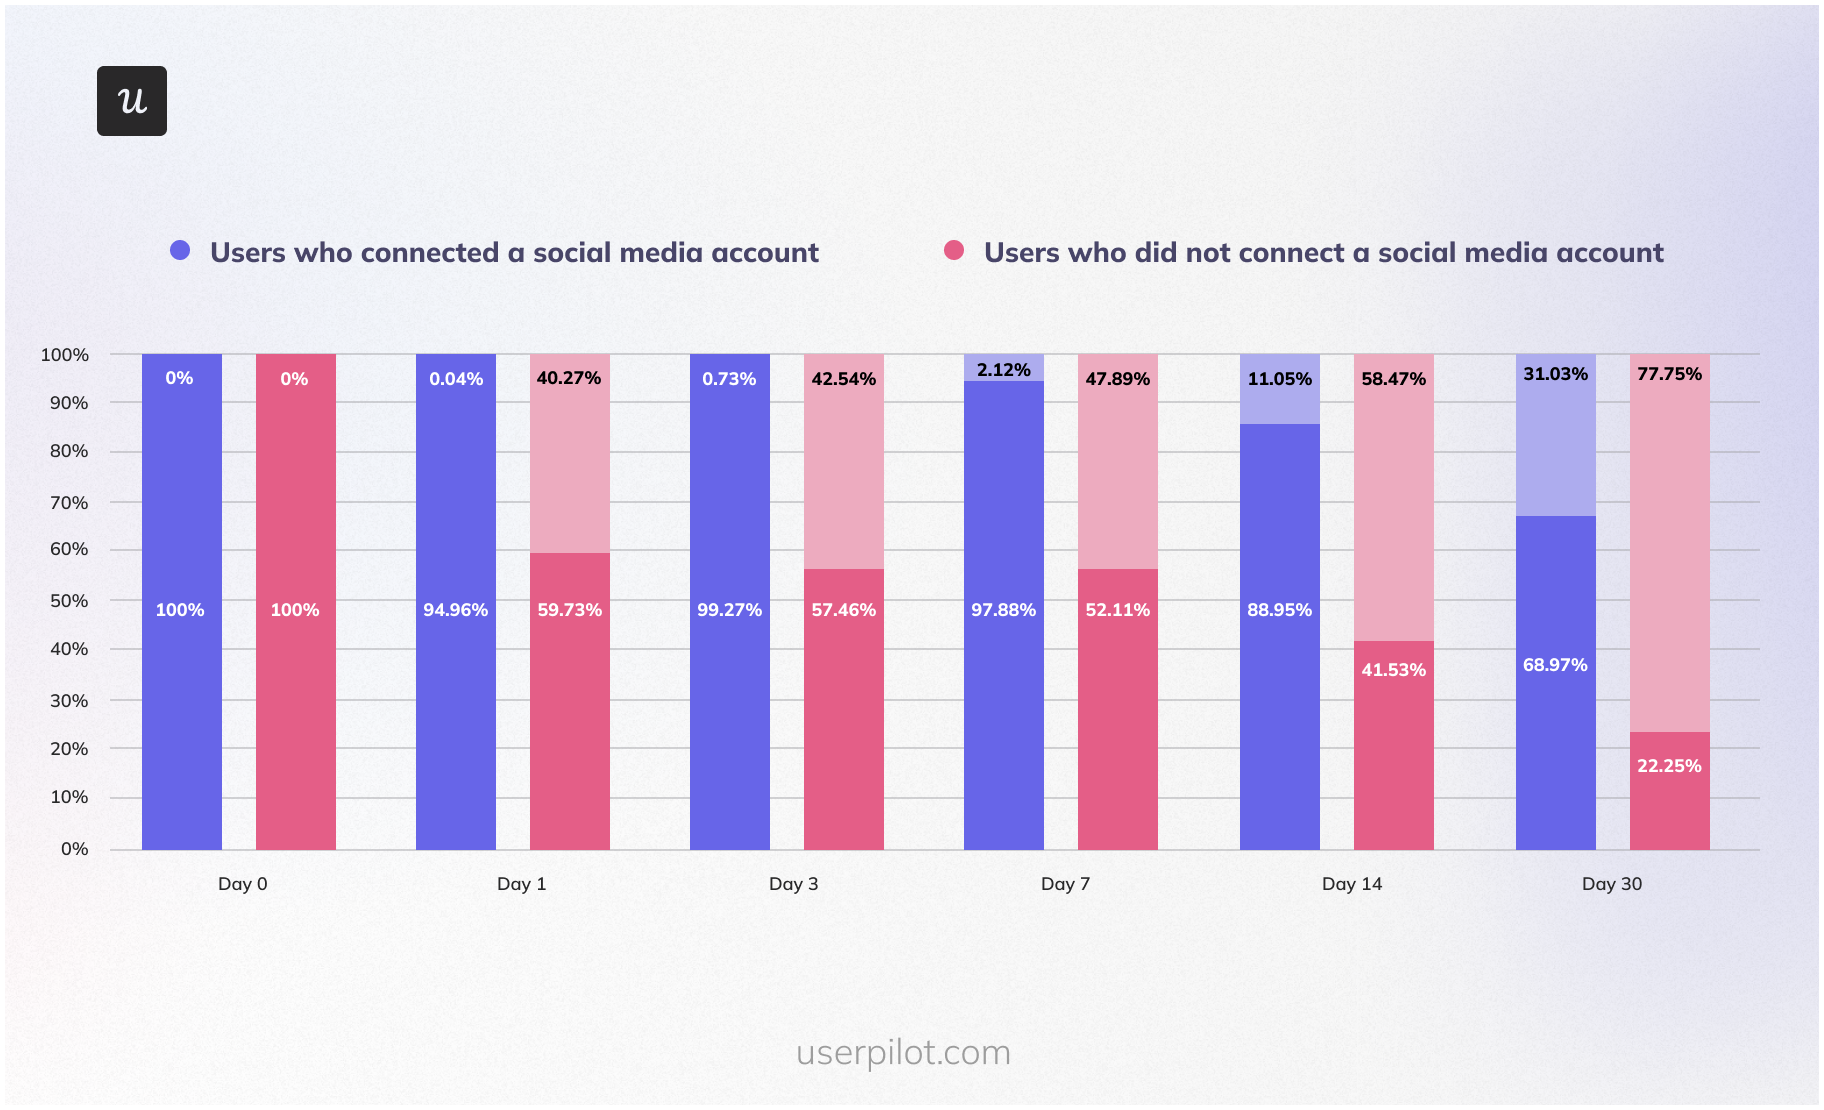
Forget monthly churn rates. The single most valuable metric for pre-PMF startups is the cohort retention curve—a visual representation of what percentage of users from each signup cohort remain active over time.
Here's what to look for: plot weekly cohorts on a graph with "weeks since signup" on the x-axis and "% still active" on the y-axis. In the early days, you'll see steep drop-offs—maybe 70% of users churn in week one. That's normal. What you're looking for is retention curve stabilization—the point where the curve flattens out.
A flattening retention curve is one of the strongest early signals of product-market fit. It means you've found a core group of users for whom your product is genuinely valuable. Even if that core is only 10% of signups, you've validated that the problem and solution are real. Now you can focus on expanding that 10% through better targeting and positioning.
For early-stage analysis, use weekly cohorts rather than monthly. With limited data, monthly cohorts take too long to reveal patterns. Weekly cohorts give you faster feedback loops. And don't worry about sample size until you have at least 50-100 users per cohort—before that, focus on qualitative insights.
Tools like an AI-powered market analysis platform can help you identify which user segments show the strongest retention signals, allowing you to double down on your most promising customer profiles.
Qualitative Churn Analysis: The Secret Weapon
What Qualitative Methods Are Best for Understanding Why Early Users Leave?
Here's the uncomfortable truth: at 100 users, your churn data isn't statistically significant enough to guide major decisions. But talking to 20 churned users? That's a goldmine.
The most powerful qualitative method is the exit interview, but timing is everything. You need to reach churned users within 48 hours of their last activity—while the experience is fresh and before they've mentally moved on. After 48 hours, response rates drop by 60% and the quality of feedback deteriorates.
During exit interviews, ask open-ended questions and listen for patterns. After 10-20 interviews, you'll start seeing recurring themes. Categorize churn reasons into three buckets:
- Problem fit: "I don't actually have this problem" or "This problem isn't painful enough to solve"
- Solution fit: "I have the problem, but your solution doesn't work for me" or "I found a better alternative"
- Execution: "The product is buggy," "I couldn't figure out how to use it," "Customer support was slow"
Problem fit issues are existential—they suggest you're targeting the wrong market or solving a non-problem. Solution fit issues mean you're on the right track but need to iterate on your approach. Execution issues are the easiest to fix and the least informative about PMF.
If 70% of your churn is execution-related, you're probably close to PMF—you just need to improve the experience. If 70% is problem fit, you need to seriously reconsider your target market or value proposition.
How Can I Differentiate Between Valuable Feedback and Noise from Early Churn?
Not all churned users are created equal. Some were never going to be good customers, and their feedback can lead you astray if you're not careful.
Use this signal vs. noise framework: valuable feedback comes from users who (1) experienced your core value proposition at least once, (2) match your target customer profile, and (3) churned despite initial engagement. These are the users who "got it" but still left—their reasons are gold.
Noise comes from users who never activated, signed up out of curiosity with no intent to use the product, or are clearly outside your target market. A B2B tool getting feedback from individual hobbyists? Noise. A productivity app hearing from someone who signed up "just to check it out"? Noise.
Here's a litmus test I use: ask churned users, "If we fixed [the issue you mentioned], would you pay 2x our current price?" If they hesitate or say no, their feedback is probably noise. If they immediately say yes, you've found signal.
Also, identify your "super users"—the 5-10% who use your product most intensely. Their feedback is 10x more valuable than average users. When super users churn, drop everything and find out why. When tire-kickers churn, note the pattern but don't over-index on individual feedback.
The Sean Ellis Test and PMF Validation
How Does the Sean Ellis Test Help Validate Product-Market Fit?
The Sean Ellis test is the gold standard for PMF validation, and it pairs perfectly with churn analysis. The test asks one simple question to your active users: "How would you feel if you could no longer use [Product]?" with three options: Very disappointed, Somewhat disappointed, or Not disappointed.
Sean Ellis, who coined the term "growth hacking," found that companies with sustainable growth had at least 40% of users answer "very disappointed." Below 40%, you're not at PMF yet—and your churn data will reflect that with unstable retention curves.
Here's how to run it correctly: survey users who have used your product at least twice in the past two weeks. Don't survey brand-new users (they haven't experienced enough value) or long-dormant users (they've already mentally churned). You need 30-40 responses minimum for meaningful results.
Interpreting results in context of churn data is crucial. If you hit 40% "very disappointed" but still see high churn, you've found PMF with a narrow segment—now you need to figure out who those disappointed users are and find more of them. This is where early-stage business ideas benefit from tight customer segmentation.
If you're below 40%, your churn analysis should focus on understanding why users aren't finding your product indispensable. Are you solving a "nice to have" instead of a "must have"? Are you targeting the wrong customer segment? Is your core value proposition unclear?
Benchmarking: What Is a "Good" Churn Rate for a Pre-PMF Startup?
I'm going to give you an answer you won't like: there is no universal "good" churn rate for pre-PMF startups. Absolute numbers are meaningless without context.
What matters is the trend. Is churn improving month-over-month as you iterate? Are newer cohorts retaining better than older ones? That's the signal you're moving toward PMF. Flat or worsening churn despite product iterations? That's a red flag.
That said, here are some category-specific considerations to calibrate your expectations:
| Business Model | Typical Pre-PMF Churn Range | PMF Signal |
|---|---|---|
| B2B SaaS (annual contracts) | 20-40% annual churn | Retention curve flattens above 60% after 12 months |
| B2B SaaS (monthly) | 10-25% monthly churn | Retention curve flattens above 40% after 6 months |
| B2C subscription | 15-40% monthly churn | Retention curve flattens above 30% after 3 months |
| Freemium (free tier) | 60-90% churn in first month | 10-20% of activated users remain engaged after 90 days |
| Marketplace (two-sided) | 40-70% monthly churn | Core power users (top 10%) show <10% monthly churn |
These ranges are deliberately wide because context matters enormously. A consumer app with network effects might see 80% first-month churn but still achieve PMF if the remaining 20% become fanatical users. A B2B tool with 15% monthly churn might be in trouble if customers are churning due to problem fit issues.
Red flags that signal fundamental problems regardless of absolute numbers: (1) Churn accelerating over time, (2) No cohort showing retention curve stabilization after 3+ months, (3) Super users churning at similar rates to casual users, (4) Majority of churn attributed to problem fit rather than execution.
Use competitive intelligence tools to understand how similar products in your category perform, but don't obsess over matching their numbers until you've validated PMF.
Building Your Churn Analysis Dashboard
You don't need expensive analytics tools pre-PMF. Here are the essential metrics to track:
- Weekly cohort retention curves (% of each signup cohort still active over time)
- Time to first value (median time from signup to first core action)
- Activation rate (% of signups who complete your "aha moment" action)
- Weekly active users / Monthly active users ratio (engagement frequency)
- Feature adoption rate (% of users who use your core value feature)
- Churn reason categorization (problem fit vs. solution fit vs. execution)
- Sean Ellis score (% "very disappointed" - run monthly)
For free tools, start with Google Sheets for cohort analysis, Mixpanel or Amplitude's free tiers for event tracking, and a simple Typeform for exit surveys. You can build a complete pre-PMF analytics stack for under $100/month.
Establish a weekly review cadence. Every Monday, look at last week's cohort retention, activation rate, and any exit interview insights. Share findings with your team in a 15-minute standup. This rhythm keeps churn insights front-of-mind without becoming an obsession.
Graduate to advanced analytics (Looker, Tableau, custom data warehouses) only after you've achieved PMF and are scaling. Pre-PMF, sophisticated analytics are a distraction from the qualitative insights that actually matter. Focus on customer journey optimization through direct user feedback first.
Turning Churn Insights Into Action
Data without action is just noise. Here's how to prioritize what you learn from churn analysis:
The Prioritization Framework:
- Problem fit issues: Highest priority. If users don't have the problem you're solving, no amount of execution will save you. Consider pivoting your target market or value proposition.
- Solution fit issues: High priority. You're solving a real problem but your approach isn't working. Iterate on your core features and positioning.
- Execution issues: Medium priority. Fix the most common ones (bugs, confusing UX) but don't over-invest in polish before validating fit.
- Edge cases and feature requests: Low priority. Note them but don't build until you see patterns across multiple users.
Distinguish between quick wins and strategic pivots. Quick wins are execution fixes you can ship in a week—fix them immediately to reduce noise in your data. Strategic pivots (changing your target market, rebuilding core features) require deeper validation through additional user research.
Communicate findings to your team with context. Don't just say "churn is 45%"—say "churn is 45%, down from 60% last month, primarily driven by improved onboarding. Remaining churn is 60% solution fit issues around [specific feature gap]. Next sprint we're testing [hypothesis] to address this."
Set realistic retention goals pre-PMF. Don't aim for "industry-standard" churn rates—aim for "improving trend" and "retention curve stabilization." A realistic goal might be: "Reduce month-1 churn by 10 percentage points and achieve retention curve stabilization above 25% by month 3 for our next 5 cohorts."
Frequently Asked Questions
How do you measure churn before achieving product-market fit?
Focus on cohort retention curves rather than absolute churn rates. Plot weekly cohorts showing the percentage of users still active over time, and look for retention curve stabilization—the point where the curve flattens. Combine this quantitative data with qualitative exit interviews conducted within 48 hours of user inactivity. Track leading indicators like time-to-value and feature adoption depth rather than lagging metrics like monthly churn rate. The goal is to understand whether you're solving a real problem, not to hit arbitrary retention benchmarks.
What is a "good" churn rate for a pre-PMF startup?
There's no universal "good" churn rate pre-PMF—context matters more than absolute numbers. What's critical is the trend: are newer cohorts retaining better than older ones? Is your retention curve stabilizing? B2B SaaS might see 10-25% monthly churn pre-PMF, while consumer apps could see 60-90% first-month churn and still achieve PMF if core users remain highly engaged. Focus on improving trends and retention curve stabilization rather than matching industry benchmarks. A flattening retention curve at any level signals you've found a core group of users who find genuine value.
How can I differentiate between valuable feedback and noise from early churn?
Valuable feedback comes from users who (1) experienced your core value proposition at least once, (2) match your target customer profile, and (3) churned despite initial engagement. Use the "would you pay 2x?" test—if a churned user would pay double your price if you fixed their issue, that's signal. Noise comes from users who never activated, signed up out of curiosity, or fall outside your target market. Prioritize feedback from your "super users" (top 5-10% most engaged) over casual users. When super users churn, investigate immediately; when tire-kickers churn, note patterns but don't over-index on individual feedback.
What are the most important leading indicators of churn in an early-stage product?
The most critical leading indicators are: (1) Time-to-value—how quickly users experience your core benefit (products delivering value in the first session have 3-4x better retention), (2) Feature adoption depth—whether users engage with your unique value proposition or just surface features, (3) Engagement frequency—daily/weekly active usage patterns, (4) Onboarding completion rate—percentage of users who finish your activation flow, and (5) Support ticket volume per user—high support needs often predict churn. These predictive metrics give you time to intervene before churn occurs, unlike lagging indicators like monthly churn rate that only tell you what already happened.
How does the Sean Ellis test help validate product-market fit?
The Sean Ellis test asks active users: "How would you feel if you could no longer use this product?" If 40% or more answer "very disappointed," you've likely achieved product-market fit. Run the test with users who've used your product at least twice in the past two weeks—not brand-new or dormant users. If you hit 40% but still see high churn, you've found PMF with a narrow segment; identify who those "very disappointed" users are and find more like them. If you're below 40%, your churn analysis should focus on understanding why users don't find your product indispensable—you may be solving a "nice to have" rather than a "must have" problem.
What qualitative methods are best for understanding why early users leave?
Exit interviews are the most powerful qualitative method, but timing is critical—reach churned users within 48 hours of their last activity while the experience is fresh. Set up automated triggers for users inactive 3-7 days, then send a personal email from a founder asking one question: "What's the main reason you stopped using our product?" Offer a $25 gift card for a 15-minute call. After 10-20 interviews, categorize churn reasons into problem fit (wrong market/non-problem), solution fit (right problem, wrong approach), or execution (bugs, UX issues). Problem fit issues are existential; solution fit issues mean iterate; execution issues are easiest to fix but least informative about PMF.
Written by Aisha Okonkwo
AI product strategist and startup advisor; previously led product at two Y Combinator-backed companies.